A higher hit count can make one record look more sensitive than another. Sort the answer key against the written response first, then compute rates with the denominators those rates actually use.
For a signal detection theory example, cross the known state of each trial with the yes-or-no response. The key says whether the signal was present. The response says whether the person reported it. That pair lands in one cell: hit, miss, false alarm or correct rejection. The count sheets further down were written so the arithmetic stays visible. Each sheet has 28 correct trials out of 40. They are practice records for an introductory class. Hearing tests, vision tests and clinical decisions sit outside this page.
| Known state on the key | Wrote Present | Wrote Absent |
|---|---|---|
| Signal present | Hit | Miss |
| Signal absent | False alarm | Correct rejection |
The Perception & Cognition guide is the topic route. The operational-definition worksheet is where a broad label such as accuracy gets pinned to a counted outcome. The Stroop planning sheet keeps a different record: ink-color naming time and naming errors.
Classify one trial before you total anything
Use a corner tick on a study card as the signal. The answer key already says whether that tick was printed. The student writes Present or Absent. The job is to sort a finished record against the key. A live detection procedure and an eyesight score stay off this sheet.
OpenStax Psychology 2e, section 5.1, describes signal detection theory as identifying a stimulus embedded in a distracting background, and it attributes early applied work on radar blips to Swets (1964). The tick-mark sort below is a paper stand-in so every cell can be checked against a key. This page does not review the 1964 paper.
Lerman, Tetreault, Hovanetz and colleagues (2010) use the same four names for an observer who answers yes or no. A hit is a yes when the signal is present. A correct rejection is a no when the signal is absent. A miss is a no when the signal is present. A false alarm is a yes when the signal is absent. Their study scored videotaped samples of aggression under a written definition. The rows here are a separate teaching device, with none of their video counts carried over.
These four rows are a worked classification written for this page. They are four trials, not the 20-and-20 sheets in the next sections, and they are not answers collected from a class.
| Trial | Key | Written response | Cell |
|---|---|---|---|
| 1 | Tick present | Present | Hit |
| 2 | Tick absent | Present | False alarm |
| 3 | Tick present | Absent | Miss |
| 4 | Tick absent | Absent | Correct rejection |
Copy the blank sheet when you want to sort a new record. Leave a row blank when the key or the response is missing. A blank is an incomplete trial, and it is not a zero.
| Trial | Key: present or absent | Response: Present or Absent | Cell | Note |
|---|---|---|---|---|
| 1 | _____ | _____ | _____ | _____ |
| 2 | _____ | _____ | _____ | _____ |
| 3 | _____ | _____ | _____ | _____ |
| 4 | _____ | _____ | _____ | _____ |
| 5 | _____ | _____ | _____ | _____ |
| 6 | _____ | _____ | _____ | _____ |
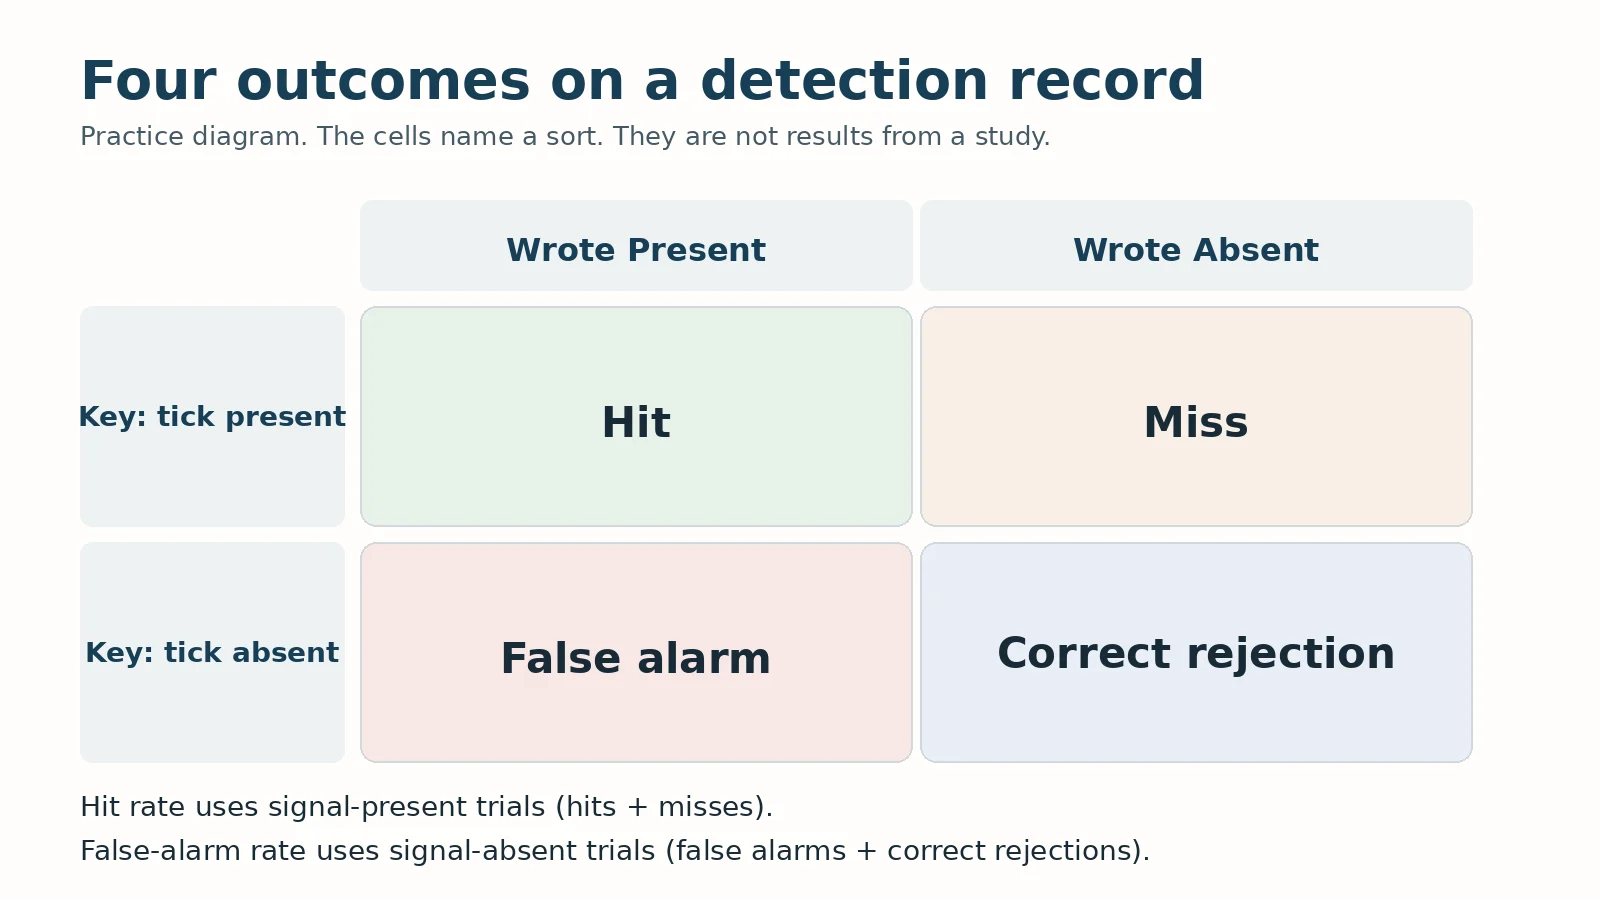
Practice diagram for sorting a detection record. The cells name the sort. They are not results from a study.
Takeaway: Name the cell from the key and the response, one trial at a time.
Put each rate over the trials that could have produced it
The Psychology in Action explainer notes that hits and misses together cover every trial on which the signal was present, and that false alarms and correct rejections together cover every trial on which it was absent. The denominators follow that split.
| Rate | Numerator | Denominator |
|---|---|---|
| Hit rate | Hits | Signal-present trials (hits + misses) |
| False-alarm rate | False alarms | Signal-absent trials (false alarms + correct rejections) |
| Percent correct | Hits + correct rejections | All trials |
On Record A below, the hit rate is 16/20, which is 0.80. Dividing those same 16 hits by all 40 trials gives 0.40. That second number is hits as a share of the whole sheet, and it is a different quantity from the hit rate. The false-alarm rate is 8/20, which is 0.40, not 8/40.
Lerman and colleagues computed their hit rate over the signal samples on the scoring key and their false-alarm rate over the noise samples. The teaching sheets use that same denominator rule with round numbers chosen here.
Takeaway: Write the denominator beside the rate. Hit rate uses signal-present trials. False-alarm rate uses signal-absent trials.
Compare two sheets that both score 70 percent
Both sheets use 20 signal-present trials and 20 signal-absent trials. The counts were chosen so the percents divide evenly. Nobody sat this task.
| Count | Record A | Record B |
|---|---|---|
| Hits | 16 | 12 |
| Misses | 4 | 8 |
| False alarms | 8 | 4 |
| Correct rejections | 12 | 16 |
| Hits + misses | 20 | 20 |
| False alarms + correct rejections | 20 | 20 |
| Hits + correct rejections | 28 | 28 |
| Percent correct | 28/40 = 70% | 28/40 = 70% |
| Hit rate | 16/20 = 0.80 | 12/20 = 0.60 |
| False-alarm rate | 8/20 = 0.40 | 4/20 = 0.20 |
| Times the response was Present | 24 | 16 |
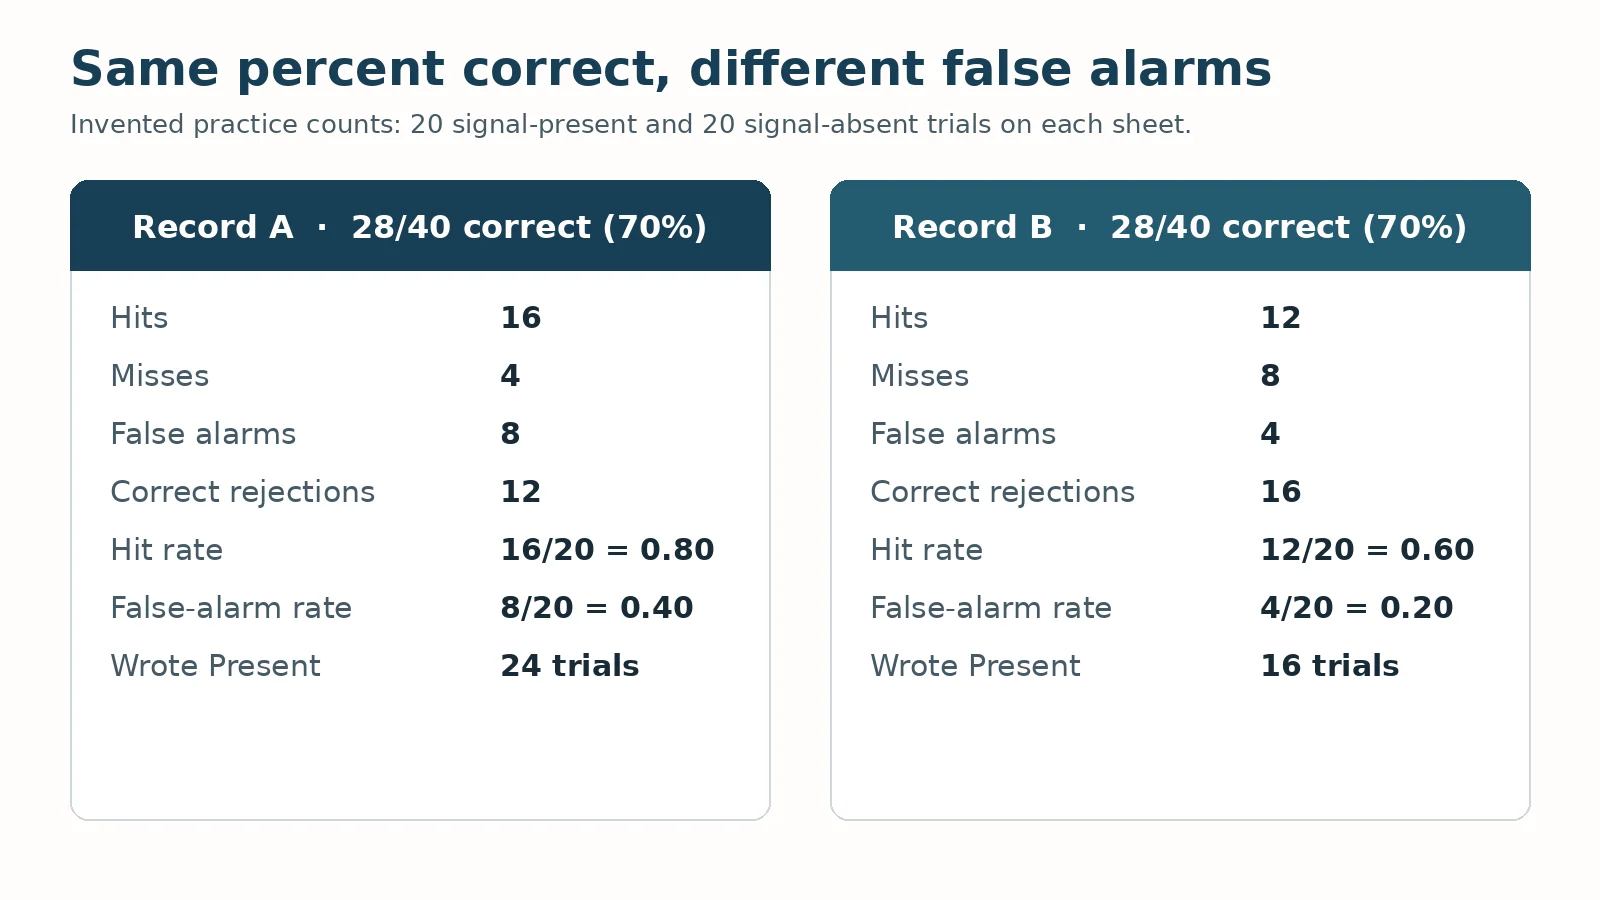
Invented practice counts for two records that share 70 percent correct. Not results from a study.
At a glance: 20 present and 20 absent on each sheet. Record A hit rate 0.80 and false-alarm rate 0.40. Record B hit rate 0.60 and false-alarm rate 0.20. Both sheets are 28/40 correct.
Lerman and colleagues write that a simultaneous increase or decrease in hits and false alarms suggests the observer changed the criterion used to score the signal. Record B has fewer hits and fewer false alarms than Record A, which is that paired pattern on these invented numbers. The same paper treats sensitivity as how well the observer separates signal from noise, and it says sensitivity is usually changed by operations that alter how ambiguous the stimulus is. These sheets include no stimulus change. The paired drop is a criterion-shaped comparison on paper. It does not measure a sensitivity advantage for B, and the extra hits on A do not measure a sensitivity advantage for A.
Psychology in Action describes d′ as the distance between the peaks of the noise distribution and the signal distribution. This page stops at the counts and the rates. It does not convert the teaching numbers into a d′.
Common mistake: Reading the higher hit count as higher sensitivity when percent correct matches and the false alarms moved with the hits.
The claim-and-evidence reading sheet is the checklist for a published paper that reports only percent correct. Ask whether the hit rate and the false-alarm rate are in the results, and which denominators they used.
Takeaway: Equal percent correct can sit on different hit rates and different false-alarm rates.
Limits of these practice counts
A sensitivity index such as d′ needs a model and a pair of rates taken from an actual procedure. These counts were written for arithmetic practice, so they do not supply a student d′. No tone, light or clinical sign was presented, so the sheets do not support a hearing score, a vision score or a clinical judgment.
Record B said Present on 16 trials and Record A said Present on 24. B used the stricter yes-rate on this pair of sheets. Whether a stricter criterion is useful depends on the cost of a miss and the cost of a false alarm. Those costs are not set here. Lerman and colleagues, citing Green and Swets (1966), say response bias is affected by the consequences of each outcome, the prior chance of the signal, the decision rule and the instructions. A class can list which of those a real study would have to specify. This page does not assign the costs or the probabilities, and it does not discuss neural mechanisms of detection.
Takeaway: The record supports a cell sort and a denominator check. A sensitivity claim needs a procedure that can separate the criterion from the stimulus.
Method and sources
The four outcome names, and the reading of a joint change in hits and false alarms as a criterion shift, were checked in the introduction of Lerman et al. (2010). The split between signal-present and signal-absent trials, and the description of d′ as a distance between distribution peaks, were checked in the Psychology in Action explainer. OpenStax Psychology 2e, section 5.1, supplies the introductory wording and the Swets (1964) attribution. That 1964 paper was not reviewed for this page. The tick-mark rows, the blank sheet and both 40-trial count sheets are original. Sources were accessed on October 11, 2026.
This page is a study aid from Intro Psych Resources, an independent psychology learning site. It does not assess or treat any psychological or medical condition.
Takeaway: Keep the published definitions separate from the counts written for practice.