Calling a weekly paycheck variable ratio fails the pause check Table 6.3 prints for a fixed interval. A weekly paycheck is a predictable time, so it is not the variable-ratio row. Table 6.3 splits partial reinforcement into fixed or variable, and ratio or interval. Figure 6.13 names a response shape for each. The section prints no numeric response rate.

Addition versus removal is a different question. That classification, and the arithmetic steps already taken on the printed example lists, are on the reinforcement comparison. These four rows also sit with the other pages in the Learning and Memory guide. This chart keeps the shape and the extinction contrast.
The four rows
| Schedule | What Table 6.3 requires | Table 6.3 result, then Figure 6.13 | Dominant misread and how to avoid it |
|---|---|---|---|
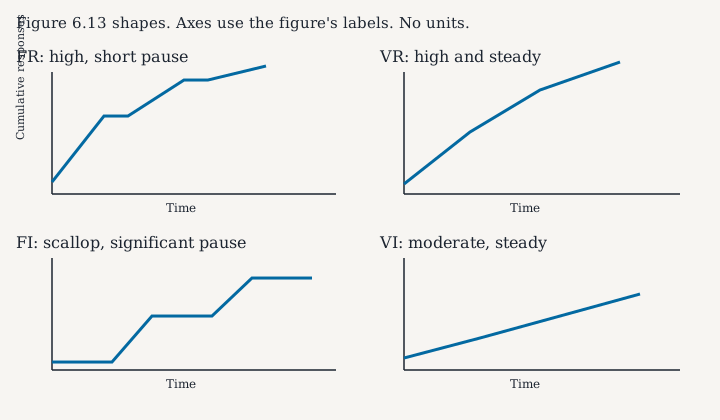
| Fixed ratio (FR) | A predictable number of responses. The printed list is 2, 4, 6, and 8 responses. The example is piecework: pay for every x items | High response rate with pauses after reinforcement. The figure adds that the pause is short | Treating the list as one running rate. The numeric rate stays blank |
| Variable ratio (VR) | An unpredictable number of responses. The printed list is 1, 4, 5, and 9. The example is gambling | High and steady response rate. The figure adds little if any pause after reinforcement | Filling a win percent from the slot-machine story. The section prints none |
| Fixed interval (FI) | A predictable time. The printed list is 5, 10, 15, and 20 minutes. The example is a hospital patient on doctor-timed pain relief. June’s line is separate: one dose per hour | Moderate response rate with significant pauses after reinforcement. The figure names that pattern a scallop | Pasting the 5-to-20-minute list onto June’s hourly dose |
| Variable interval (VI) | An unpredictable time. The printed list is 5, 7, 10, and 20 minutes. The table example is checking social media. The prose example is a quality-control visit | Moderate yet steady response rate. The figure uses the same words: moderate, steady | Collapsing it with VR because both are “variable.” One counts responses. The other counts time |
Continuous reinforcement, defined just before the table, delivers a reinforcer every time the behavior is displayed. The section calls that the quickest way to teach someone a behavior, and says it is especially effective in training a new behavior. Partial reinforcement withholds the reinforcer on some performances. The four rows are that partial case.
Equal steps mark “fixed”
Step = later printed example − earlier printed example.
On the fixed-ratio list, 4 − 2 = 2, 6 − 4 = 2, and 8 − 6 = 2. The steps match. On the variable-ratio list, 4 − 1 = 3, 5 − 4 = 1, and 9 − 5 = 4. The steps do not match. The same check on the minute lists: fixed interval steps are 5, 5, and 5; variable interval steps are 2, 3, and 10. Equal steps are what “fixed” means on these printed lists. They are not a response rate, and they are not a win percent. Those blanks are already marked on the reinforcement comparison.
June’s line stays separate. The section says one dose per hour, and that a press before the allotted time brings no medication. That is one fixed interval. It is not the 5, 10, 15, 20 minute list.
Extinction, as the section ranks it
Extinction here means the reinforced behavior decreases after reinforcement stops. The section says the speed depends on the schedule. On a variable-ratio schedule, the point of extinction comes very slowly. On the other schedules, extinction may come quickly. The June example is the fixed-interval case: when the dose does not come at the expected time, extinction occurs quickly.
The section then ranks two ends. Variable ratio is the most productive and the most resistant to extinction. Fixed interval is the least productive and the easiest to extinguish. It does not print a third-place or fourth-place order for fixed ratio and variable interval, so this chart does not add one.
The same section says fixed ratios are better suited to optimize the quantity of output, whereas a fixed interval, in which the reward is not quantity based, can lead to a higher quality of output. That sentence is about quantity versus quality in the eyeglass and hospital examples. It is not a measured rate.
Rules of thumb
If the requirement is a count of responses and the count does not change, the row is fixed ratio. The Figure 6.13 shape for that row is a high rate with a short pause. The numeric rate stays blank.
If the requirement is a count of responses and the count changes, the row is variable ratio. Table 6.3 calls that result high and steady. The section also calls variable ratio the most resistant to extinction. A win percent still stays blank.
If the requirement is a clock time and the time does not change, the row is fixed interval. The named shape is a scallop. The section calls this row the easiest to extinguish. June’s clock is one hour, not the 5-to-20-minute list.
If the requirement is a clock time and the time changes, the row is variable interval. The named shape is moderate and steady. “Variable” alone does not make it variable ratio.
When this chart does not apply
This page does not decide whether a stimulus was added or removed. That is the reinforcement comparison. It does not turn the gambling story into a win percent, and it does not give a response rate the section left unprinted. It is a reading chart for section 6.3. It is not a treatment plan, a classroom behavior program, or a clinical assessment.
Method and sources
The schedule split, Table 6.3’s example lists and result words, the Figure 6.13 shape words, June’s one dose per hour, the quantity-versus-quality sentence, and the extinction ranking are from OpenStax Psychology 2e, section 6.3, retrieved 20 October 2026. The subtractions are arithmetic on the lists printed in that table. They are not new findings. The schematic is original and carries no units the section did not print.